Unemployment Rates Over Time (I)
03 Oct 2017I was curious to see seasonal unemployment rates by race/ethnicity and gender over time. Another reason for the next couple posts is to show how to scrape html data from the web (specifically Bureau of Labor Statistics (BLS) website), prepare and plot the data by important grouping variables. The time series plot data were obtained from here – I selected the seasonally adjusted and saved in my local drive. All data wrangling and plotting was done in R.
In the second post, I will look at unemployment rates by race/ethnicity and gender over six time points (Aug 2016 - Aug 2017)
as provided in the BLS website here and here
for Hispanic/Latino at the time of writing this post. In the third post, I will provide a quick look at R codes that created all these plots.
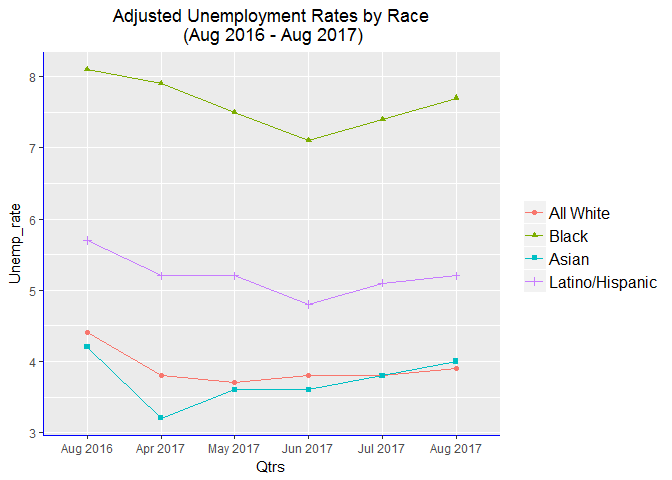
Here is a plot of unemployment rates by race/ethnicity over time (for the last one year at 6 time points).

- What would 10 year monthly unemployment rates by Race/Ethnicity look like? … see plot at the end of the post!
The plot above shows seasonal unemployment rates by race/ethnicity at six time points during the last year. Note that the ‘All White’ category includes non-Caucasian Whites that maybe of Hispanic/Latino origin. It is not straight forward to remove the Hispanic/Latino group from the ‘All White’ category and for demonstration purposes I left the data as it is.
Unequal distribution of wealth, burden of diseases and mortality has been observed for generations. There are several sources for these differences. Difference in occupational status is one of the sources.
I first became interested in disparities research after taking a quantitative health research class where I read about differences in how people from different race/ethnic backgrounds interacted with the health care system.
In my dissertation, I looked at the direct and indirect relationships of socioeconomic status (SES) factors to health status and health care services utilization. Until I looked at the literature and reports, I did not realize the great wealth disparities by race/ethnicity.
So, I was curious about employment/unemployment rates over time given official government data. Obviously, employment, education, income, wealth and health are related but this relationship maybe different for different groups.
From the plot above it would seem that Asians have lower unemployment rates than Caucasian Whites but once the Latino/Hispanic group is removed from the “All White” group, unemployment rates among Caucasian Whites is likely to be lower than observed in the plot. What is interesting in this plot is that unemployment rates among Hispanic/Latino groups is much lower than unemployment rates among Black/African Americans.
- A Time Series Plot of seasonal unemployment rates by Race/Ethnicity (2007 - 2017)
Unemployment rates for Black/African American groups is almost always two times higher than that of Asians and Whites. You can also observe that month to month changes in unemployment are higher in the Asian and Black groups. Why?

Despite the wide perception (& actual gains in many aspects of life for minorities) about improved experience regarding better employment, wealth accumulation and health outcomes, published indicators show consistent lag for minorities in general but for Blacks/African Americans in particular. Monthly unemployment rate trends over the last 10 years (as provided in the plot above) show similar rise and decline for each race/ethnic group. What will the plot for the next 10 years (2018-2027) look like?